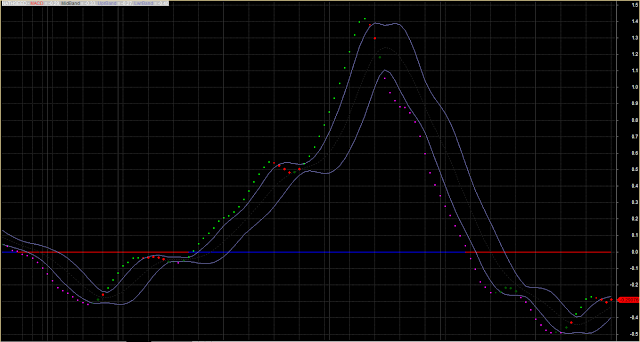
Click Image To Enlarge. Please Rate And Comment.
global g_m, g_s;

_SECTION_BEGIN("Background");
SetChartBkGradientFill( ParamColor("BgTop", colorBlack),ParamColor("BgBottom", colorBlack), colorLightGrey);
_SECTION_END();


_SECTION_BEGIN("Enable/Disable");
ShowMACDLine = ParamToggle("Show MACD Line?", "No|Yes");
ShowBB = ParamToggle("Show MACD-BB?", "No|Yes", 1);
ShowStdDev = ParamToggle("Show MA For StdDev?", "No|Yes", 1);
_SECTION_END();


_SECTION_BEGIN("Styles");
sShapeBtwBB = ParamList("Shape between BB", "Small|Big", 1);
_SECTION_END();


_SECTION_BEGIN("Colors");
cMacdLine=ParamColor("MACD Line", colorOrange);
cUprBB = ParamColor("UpperBand", colorBlueGrey);
cLwrBB = ParamColor("LowerBand", colorBlueGrey);

cMacdGeUprBB = ParamColor("MacdGeUprBB", colorBrightGreen);
cMacdLeLwrBB = ParamColor("MacdLeLwrBB", ColorRGB(255,0,255));

cMacdLtUprBB = ParamColor("MacdLtUprBB", colorRed);
cMacdGtLwrBB = ParamColor("MacdGtLwrBB", colorDarkGreen);

cZLUp = ParamColor("Above Zeroline", ColorRGB(0,0,140));
cZLDn = ParamColor("Below Zeroline", ColorRGB(130,0,0));

_SECTION_END();


_SECTION_BEGIN("MACDBB");
r1 = Param("Fast MA Period", 12);
r2 = Param("Slow MA Period", 26);
//r3 = Param("Signal Period", 9);

r4 = Param("StdDev Period",  10);
SDCnt = Param("StdDev", 1.0, 1,10, 0.1);

MAforStdDev = ParamList("MA for StdDev", "SMA|EMA");

_SECTION_END();


g_m= EMA(C,r1)-EMA(C,r2);
m1 = Ref(g_m, -1);

if (MAforStdDev=="EMA")
  g_s = EMA(g_m,r4);
else
  g_s = MA(g_m,r4);


SD = StDev( g_m, r4);

BBtop= g_s + SDCnt*sD;
BBbot= g_s - SDCnt*sD;


if (ShowMACDLine) Plot(g_m,"",cMacdLine);


if (ShowBB)
{
 ThisColor = IIf(g_m>=BBtop AND g_m>=m1, cMacdGeUprBB,
        IIf(g_m<=BBbot AND g_m<=m1, cMacdLeLwrBB,
        IIf(g_m>g_s, cMacdLtUprBB, cMacdGtLwrBB)));

Plot(g_m,"MACD", ThisColor,styleDots|styleNoLine);

if (sShapeBtwBB=="Big")
{
ThisShape = IIf(g_m>BBtop, shapeNone,
            IIf(g_m<BBbot, shapeNone,
            shapeSmallCircle));

PlotShapes( ThisShape, ThisColor,0,Null, 0  );
}


}

if (ShowStdDev)
Plot(g_s,"MidBand", colorDarkGrey, styleDashed|styleNoLabel);

if (ShowBB)
{
Plot(BBtop,"UprBand",cUprBB, styleNoLabel);
Plot(BBbot,"LwrBand",cLwrBB, styleNoLabel);
}


Plot(0,"", IIf(g_m>=0, colorBlue, colorRed), styleNoLabel);


RequestTimedRefresh( 0 );

