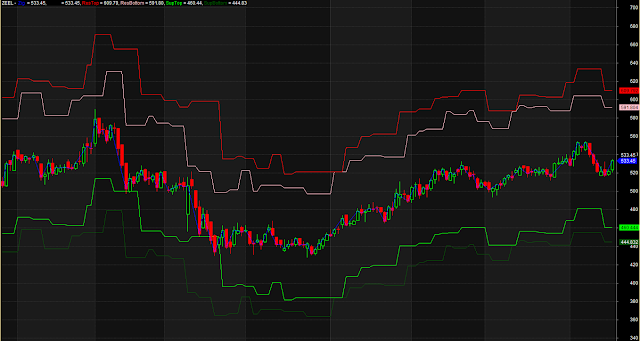
Click Image To Enlarge. Please Rate And Comment.
_SECTION_BEGIN("Natasha");


       Sen=Param("Zig",0.03,0.01,20,0.01)  ;


                   PeakVal = Peak( H, Sen ) ;
                   TroughVal = Trough( L, Sen ) ;
                   Plot(Zig(C,Sen)," Zig " ,  colorBlue,styleLine) ;
                   Plot(C," close",colorBlack,64) ;

         PivotTop = sqrt (PeakVal);
         PivotBottom= sqrt (TroughVal);

          ResA = (PivotTop + 1.618) ^ 2 ; // Fibonacci Golden Ratio
          ResB = (PivotBottom + 1.618) ^ 2 ;
 SupportA = (PivotTop - 1.618) ^ 2 ;
 SupportB = (PivotBottom - 1.618) ^ 2 ;

                       Plot(ResA,"ResTop",colorRed,1);
                       Plot(ResB,"ResBottom",colorPink,1);
                                              Plot(SupportA,"SupTop",colorBrightGreen,1);
                                             Plot(SupportB,"SupBottom",colorDarkGreen,1);
                 Filter=1;

       AddColumn(PeakVal,"peak",1.2,colorGreen);
       AddColumn(TroughVal,"Trough",1.2,colorRed);
                 AddColumn(ResA,"ResTop",1.2,colorRed);
                 AddColumn(ResB,"ResBot",1.2,colorPlum);
                 AddColumn(SupportA,"SupTop",1.2,colorGreen);
                 AddColumn(SupportB,"SupBottom",1.2,colorDarkGreen);

   GraphXSpace =8 ;


_SECTION_END();

