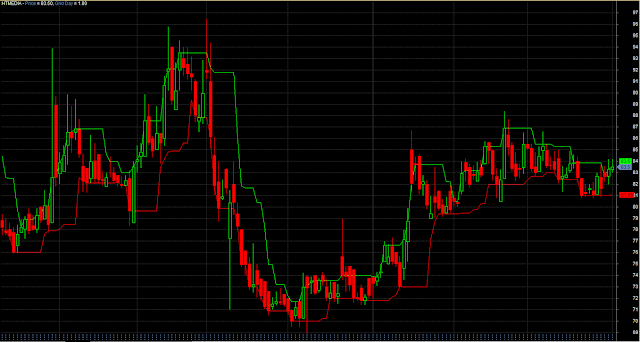
Click Image To Enlarge. Please Rate And Comment.
SetChartBkGradientFill( ParamColor("Inner panel upper",colorBlack),ParamColor("Inner panel lower",colorBlack));

Plot( C, "Price", 3,64);
H2 =  Max( Ref(C,-1), Max( C,L ) );
L2 =  Min( Ref(C,-1), Min( C,H ) );
xt=Param("per",7,5,20,1);
Plot(HHV(H2,xt),"",5,1);
Plot(LLV(L2,xt),"",4,1);

grid_day = IIf(Day()!=Ref(Day(),-1),1,0);
Plot(grid_day,"Grid Day",3,styleHistogram|styleDashed|styleNoLabel|styleOwnScale);

